Our Data
New First-Year Students Enrollment Data
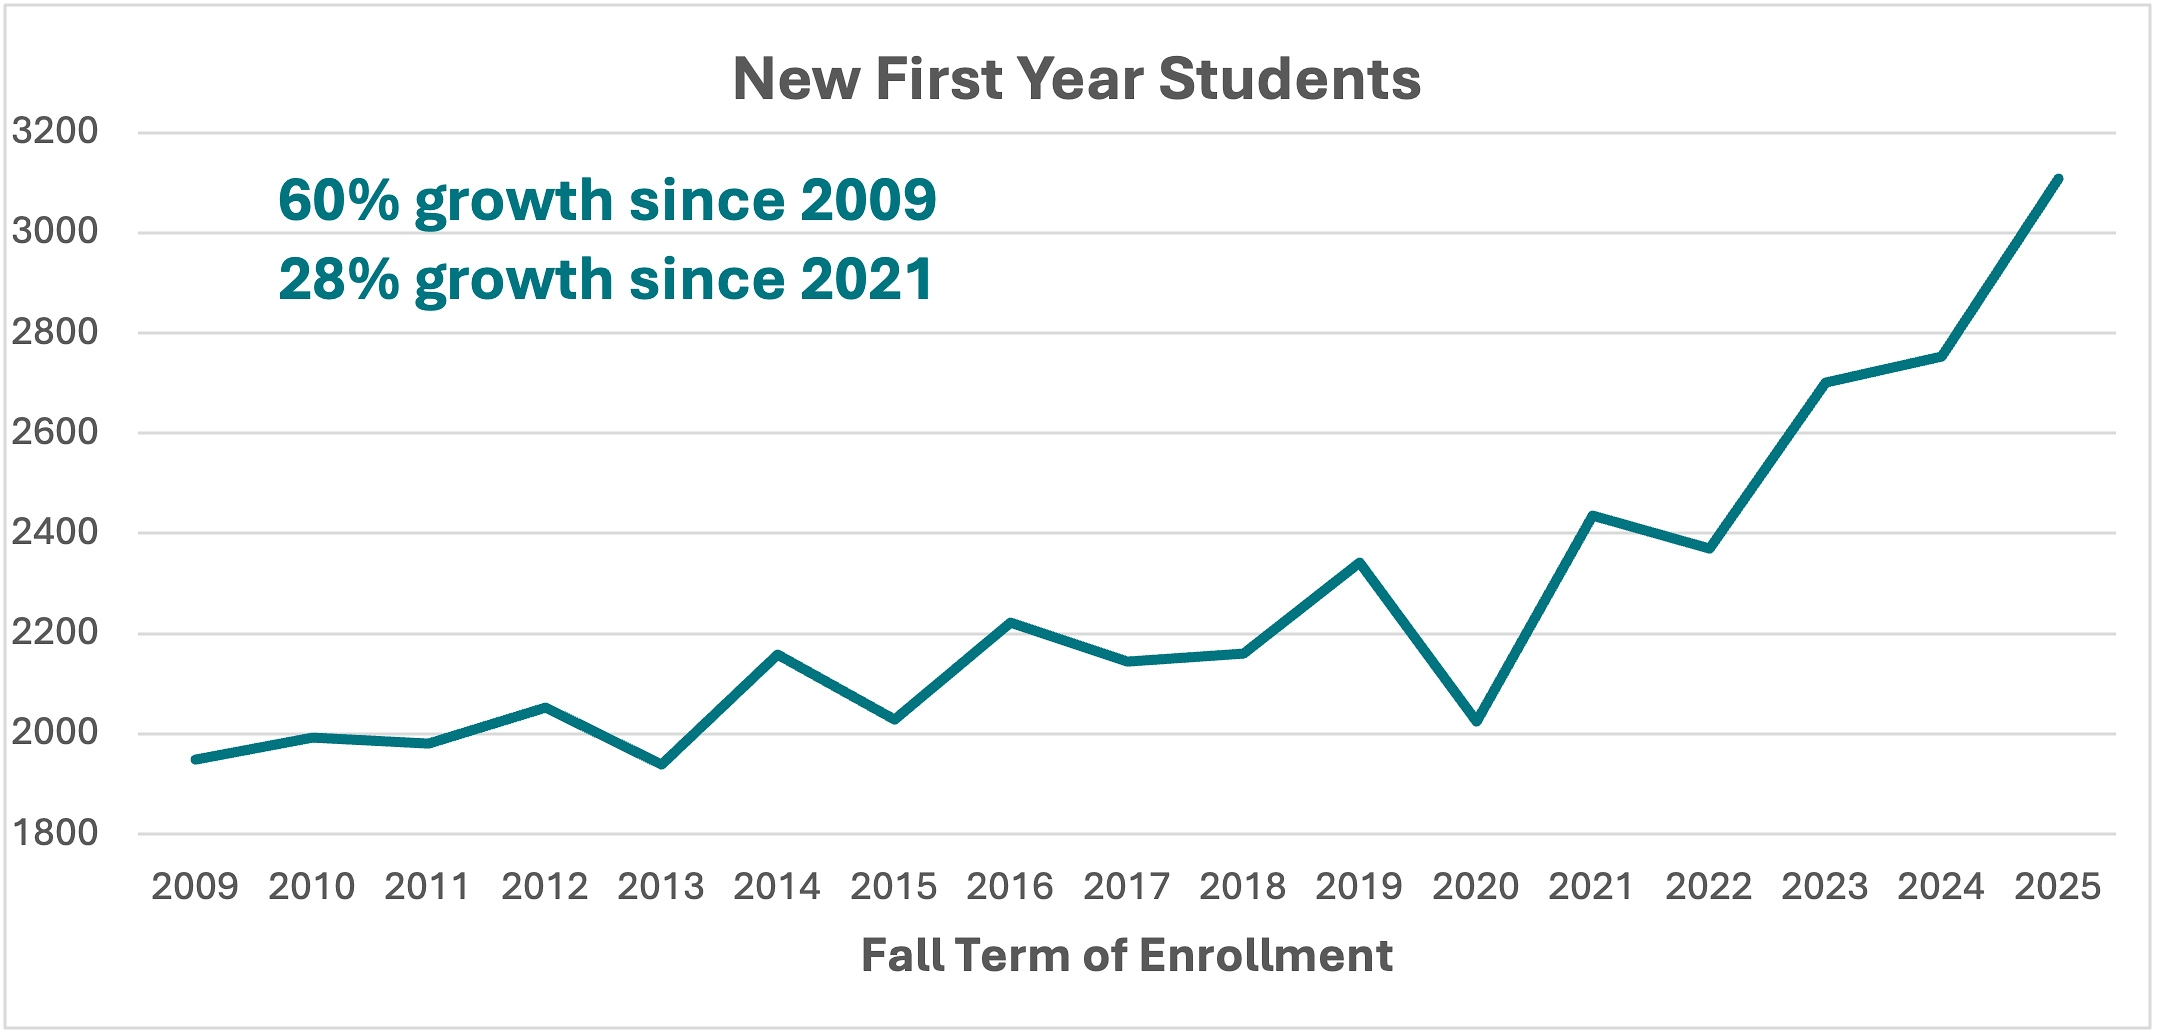
New First-Year Students Enrollment Table Data
This table provides a detailed view of the new first-year student data (2021-2025) shown in the chart above.
| Headcount Type | Fall 2021 | Fall 2022 | Fall 2023 | Fall 2024 | Fall 2025 |
|---|---|---|---|---|---|
| New First-Year Students | 2,435 | 2,370 | 2,701 | 2,754 | 3,109 |
New Transfer Students Enrollment Data
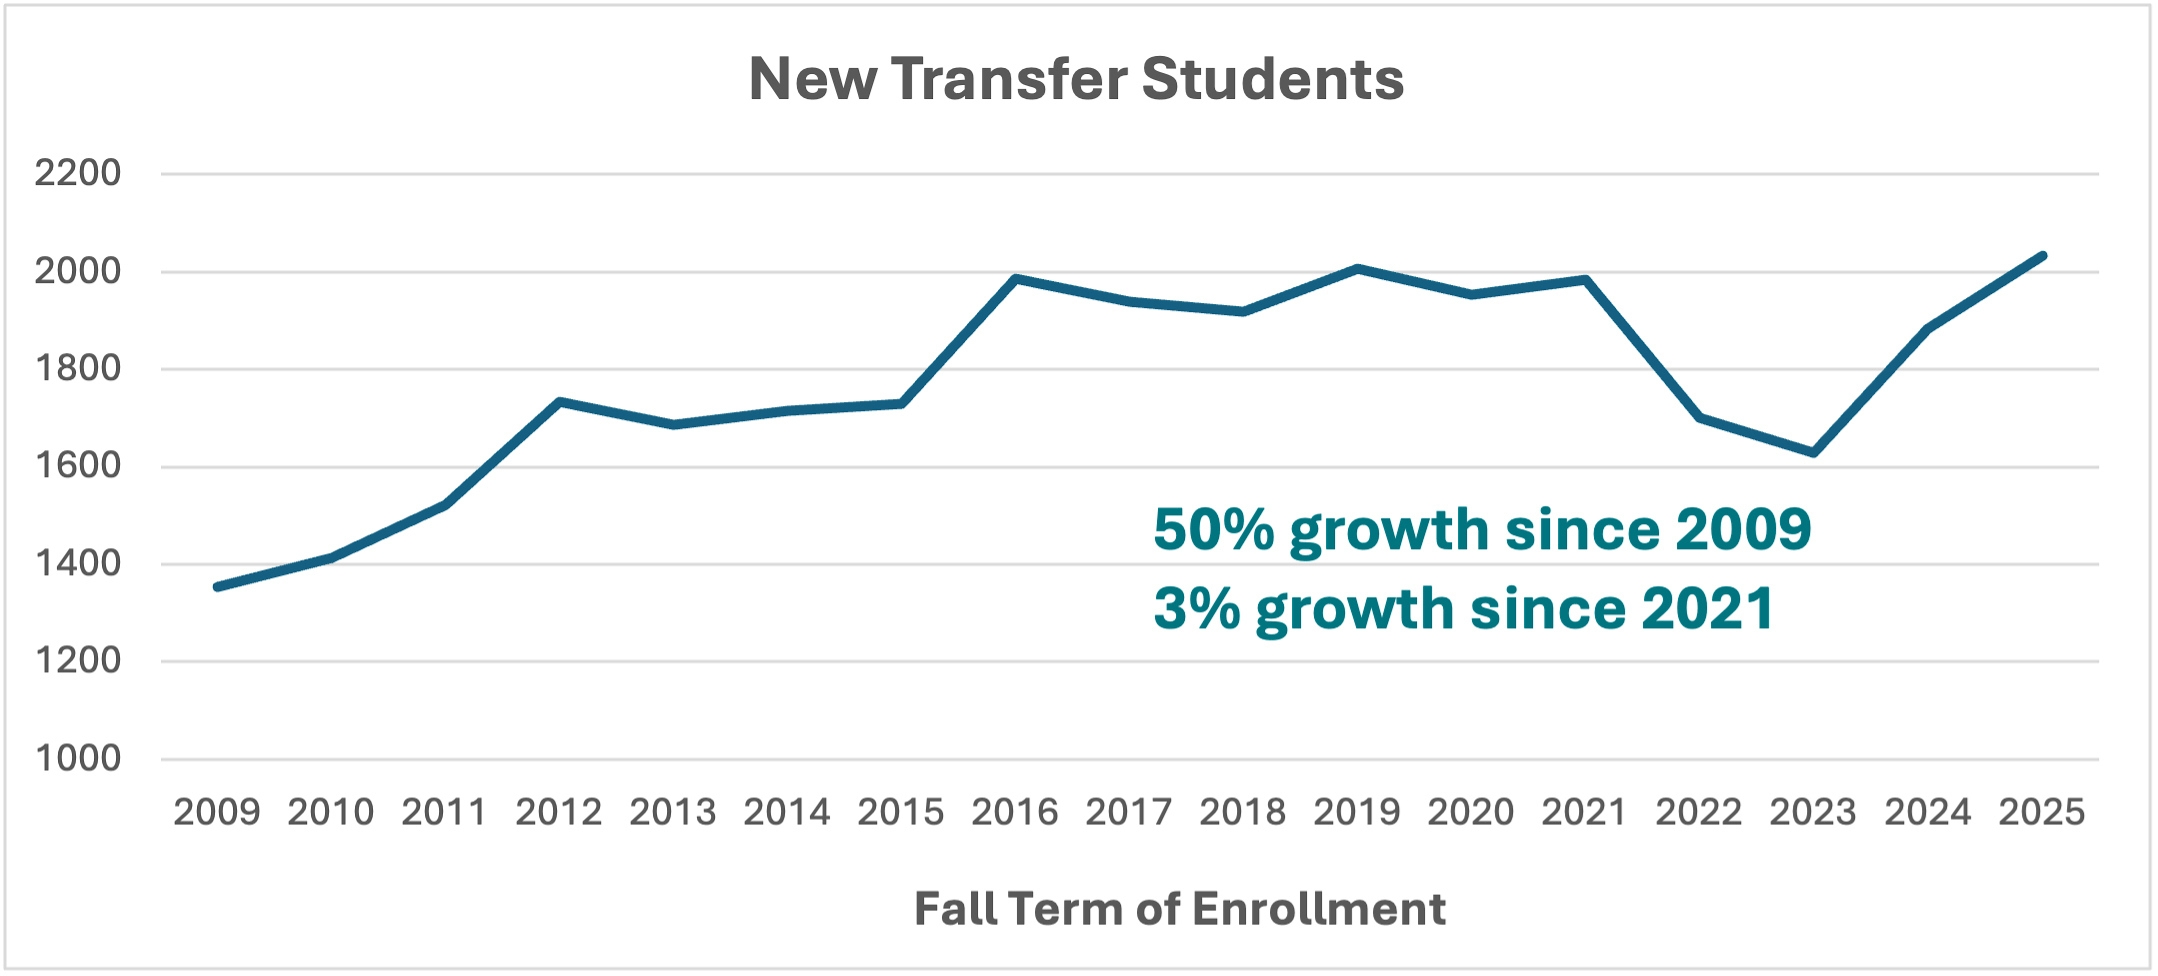
New Transfer Students Enrollment Table Data
This table provides a detailed view of the new transfer student data (2021-2025) shown in the chart above.
| Headcount Type | Fall 2021 | Fall 2022 | Fall 2023 | Fall 2024 | Fall 2025 |
|---|---|---|---|---|---|
| New Transfer Students | 1,984 | 1,701 | 1,629 | 1,881 | 2,034 |
Student Debt Data
| 2022 | 2023 | 2024 | 2025 | % Change | |
|---|---|---|---|---|---|
| # of First-Time Graduates | 1,444 | 1,527 | 1,469 | 1,575 | |
| Average Debt | $10,752 | $9,480 | $9,230 | $8,930 | -16.9% |
| 2022 | 2023 | 2024 | 2025 | % Change | |
|---|---|---|---|---|---|
| # of Transfer Graduates | 1,399 | 1,402 | 1,391 | 1,371 | |
| Average Debt | $8,226 | $7,,578 | $7,139 | $7,888 | -4.1% |
Source: UNC System Student Data Mart - System Office Strategic Metrics
First-Year Retention Rates Compared to UNC System
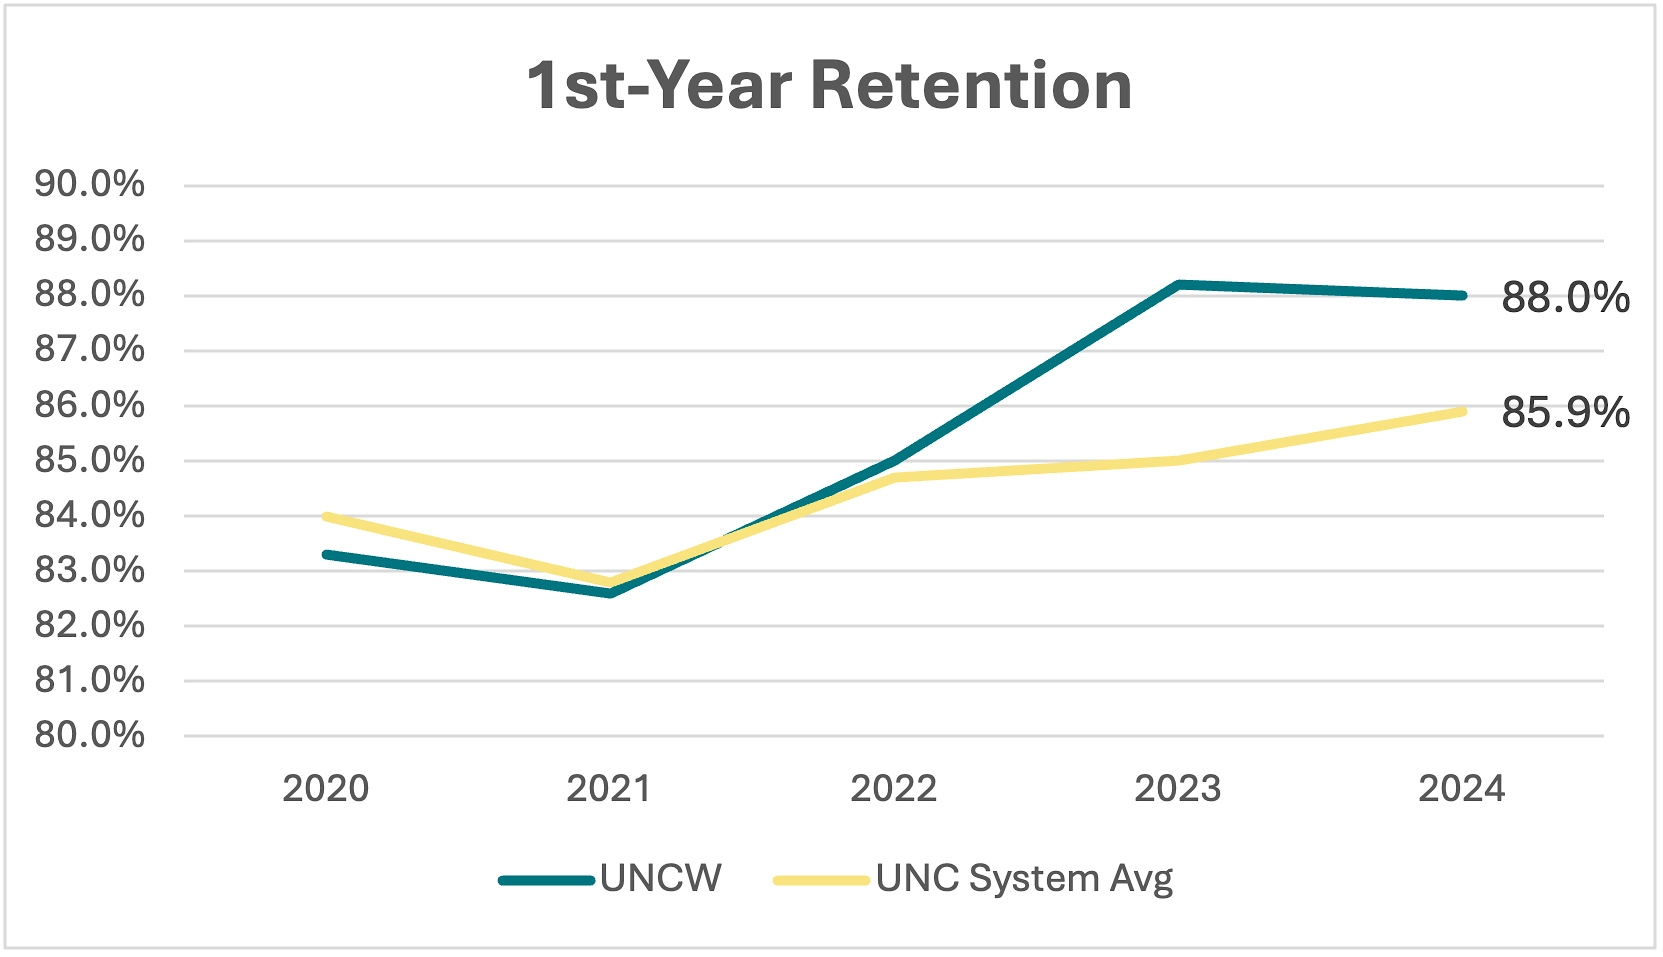
First-Year Retention Rates Compared to UNC System Table Data
This table provides a detailed view of the new first-year retention rates compared to the UNC System data shown in the chart above.
| Cohort Term | UNCW | UNC System Average |
|---|---|---|
| 2020 | 83.30% | 84.00% |
| 2021 | 82.60% | 82.80% |
| 2022 | 85.00% | 84.70% |
| 2023 | 88.20% | 85.00% |
| 2024 | 88.00% | 85.90% |
Four-Year Graduation Rates Compared to UNC System
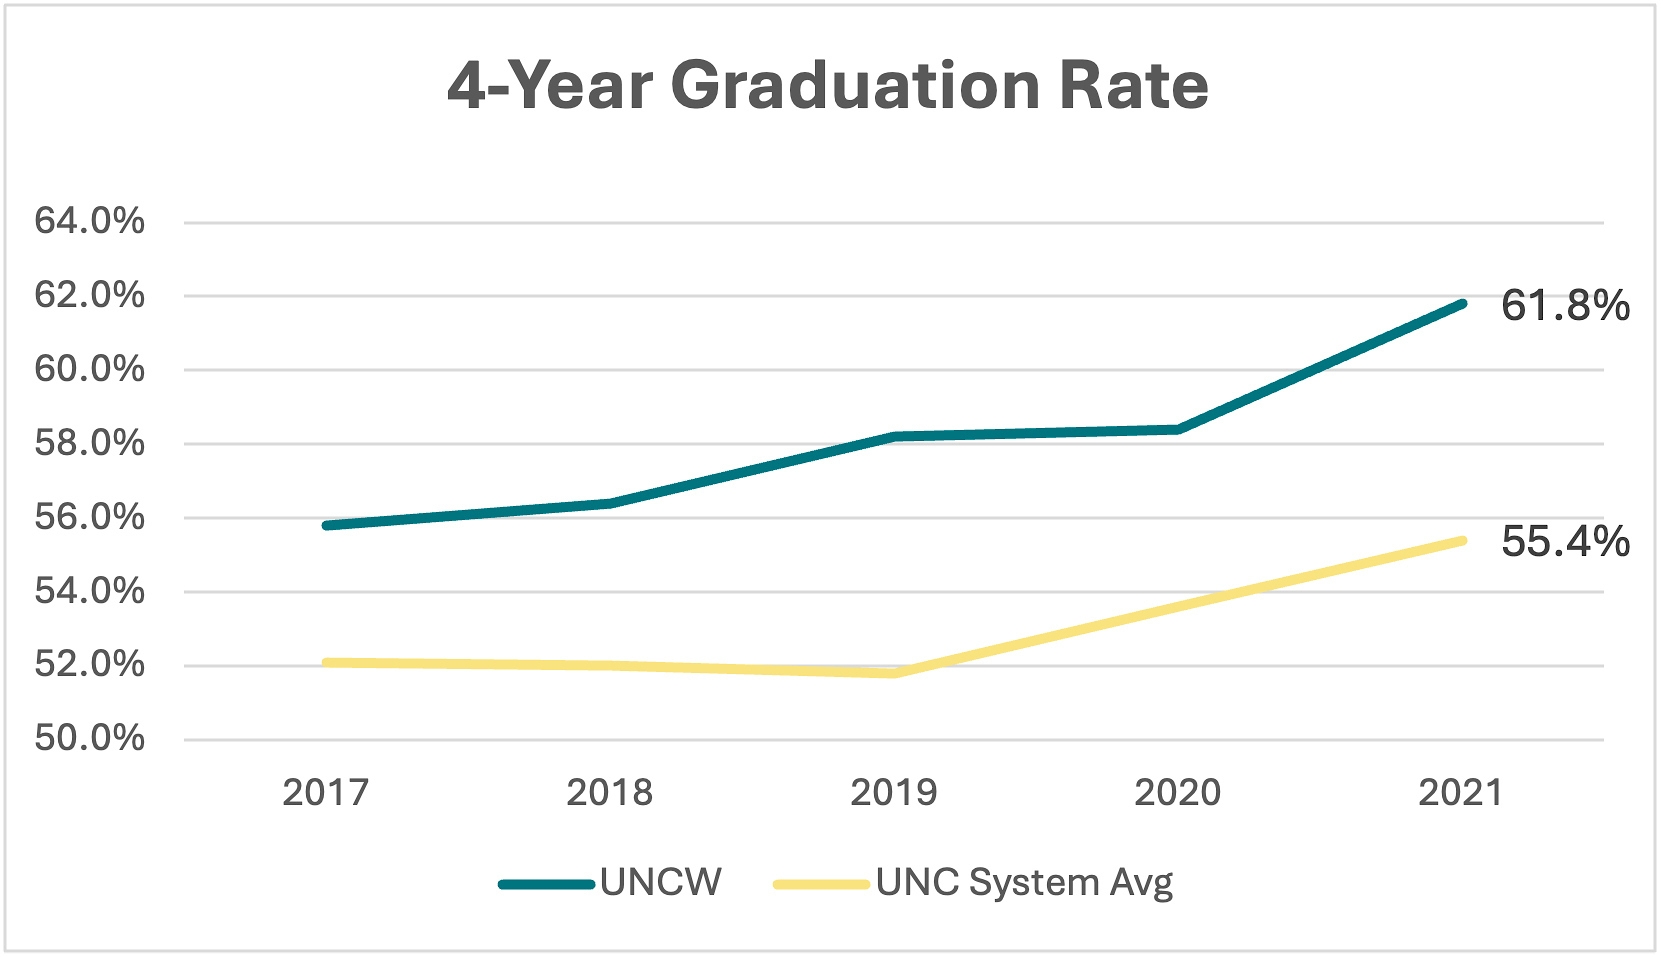
Four-Year Graduation Rates Compared to UNC System Table Data
This table provides a detailed view of the four-year graduation rates compared to the UNC system data shown in the chart above.
| Cohort Term | UNCW | UNC System Average |
|---|---|---|
| 2017 | 55.80% | 52.10% |
| 2018 | 56.40% | 52.00% |
| 2019 | 58.20% | 51.80% |
| 2020 | 58.40% | 53.60% |
| 2021 | 61.80% | 55.40% |
Six-Year Graduation Rates Compared to UNC System
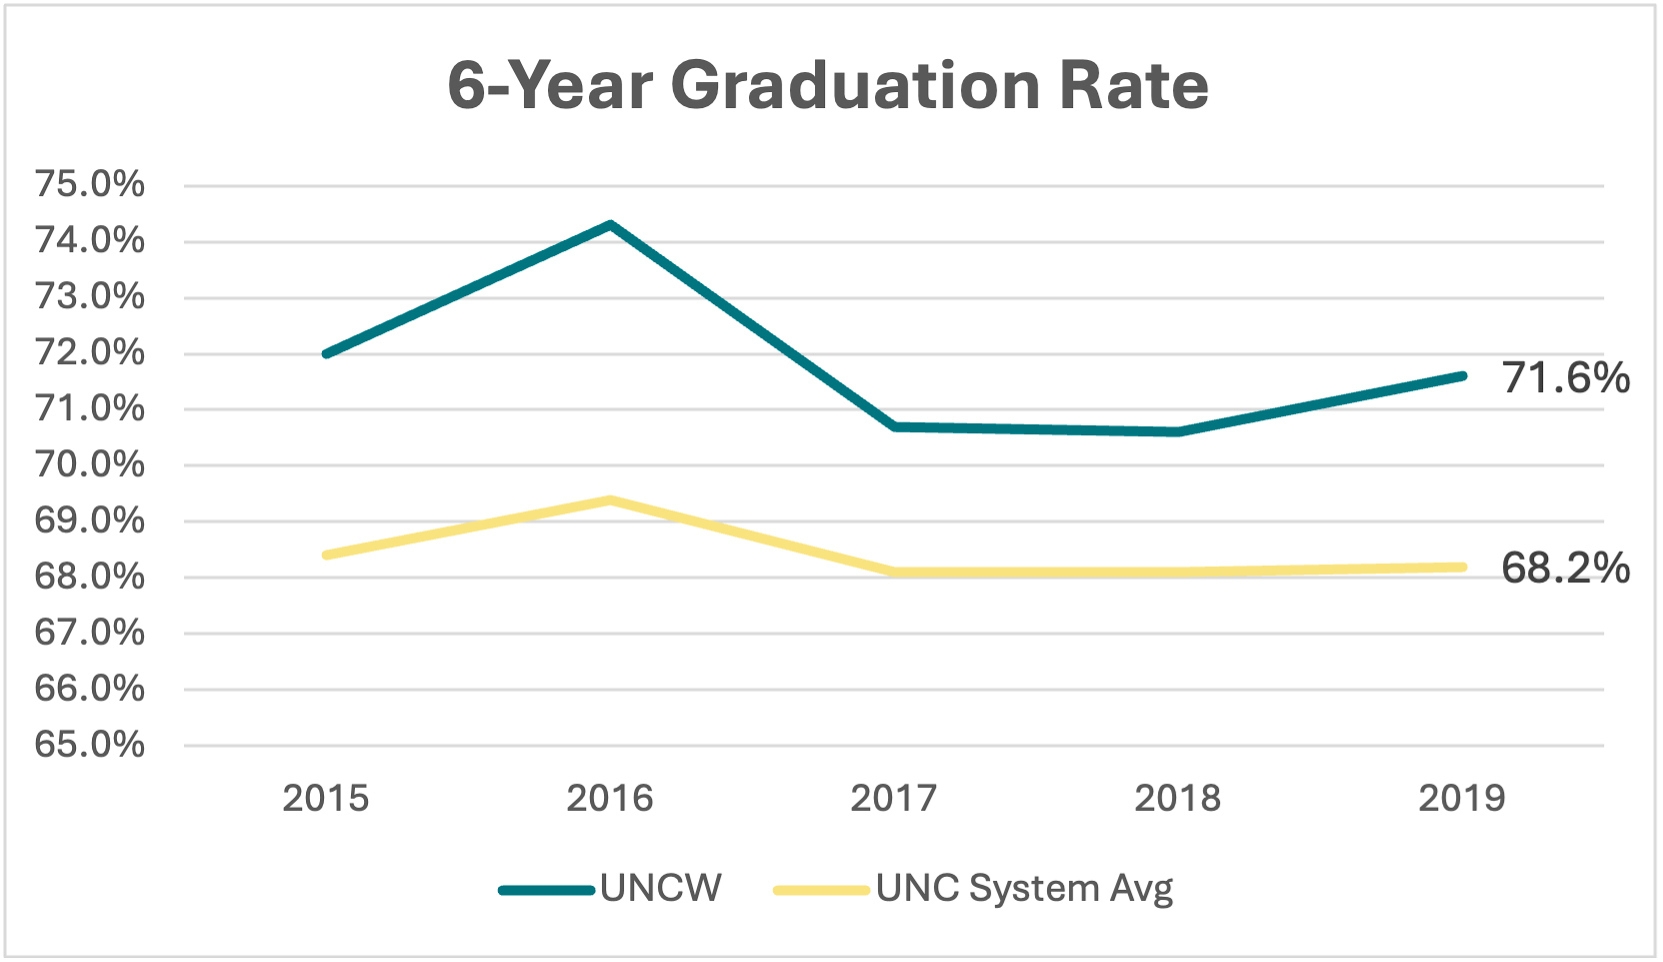
Six-Year Graduation Rates Compared to UNC System Table Data
This table provides a detailed view of the six-year graduation rates shown in the chart above.
| Cohort Term | UNCW | UNC System Average |
|---|---|---|
| 2015 | 72.00% | 68.40% |
| 2016 | 74.30% | 69.40% |
| 2017 | 70.70% | 68.10% |
| 2018 | 70.60% | 68.10% |
| 2019 | 71.60% | 68.20% |
Nationally Prominent Programs
UNCW Research Productivity - Sponsored Programs
This data shows progress on Priority 8 (research enterprise) of the Nationally Prominent Programs pillar.
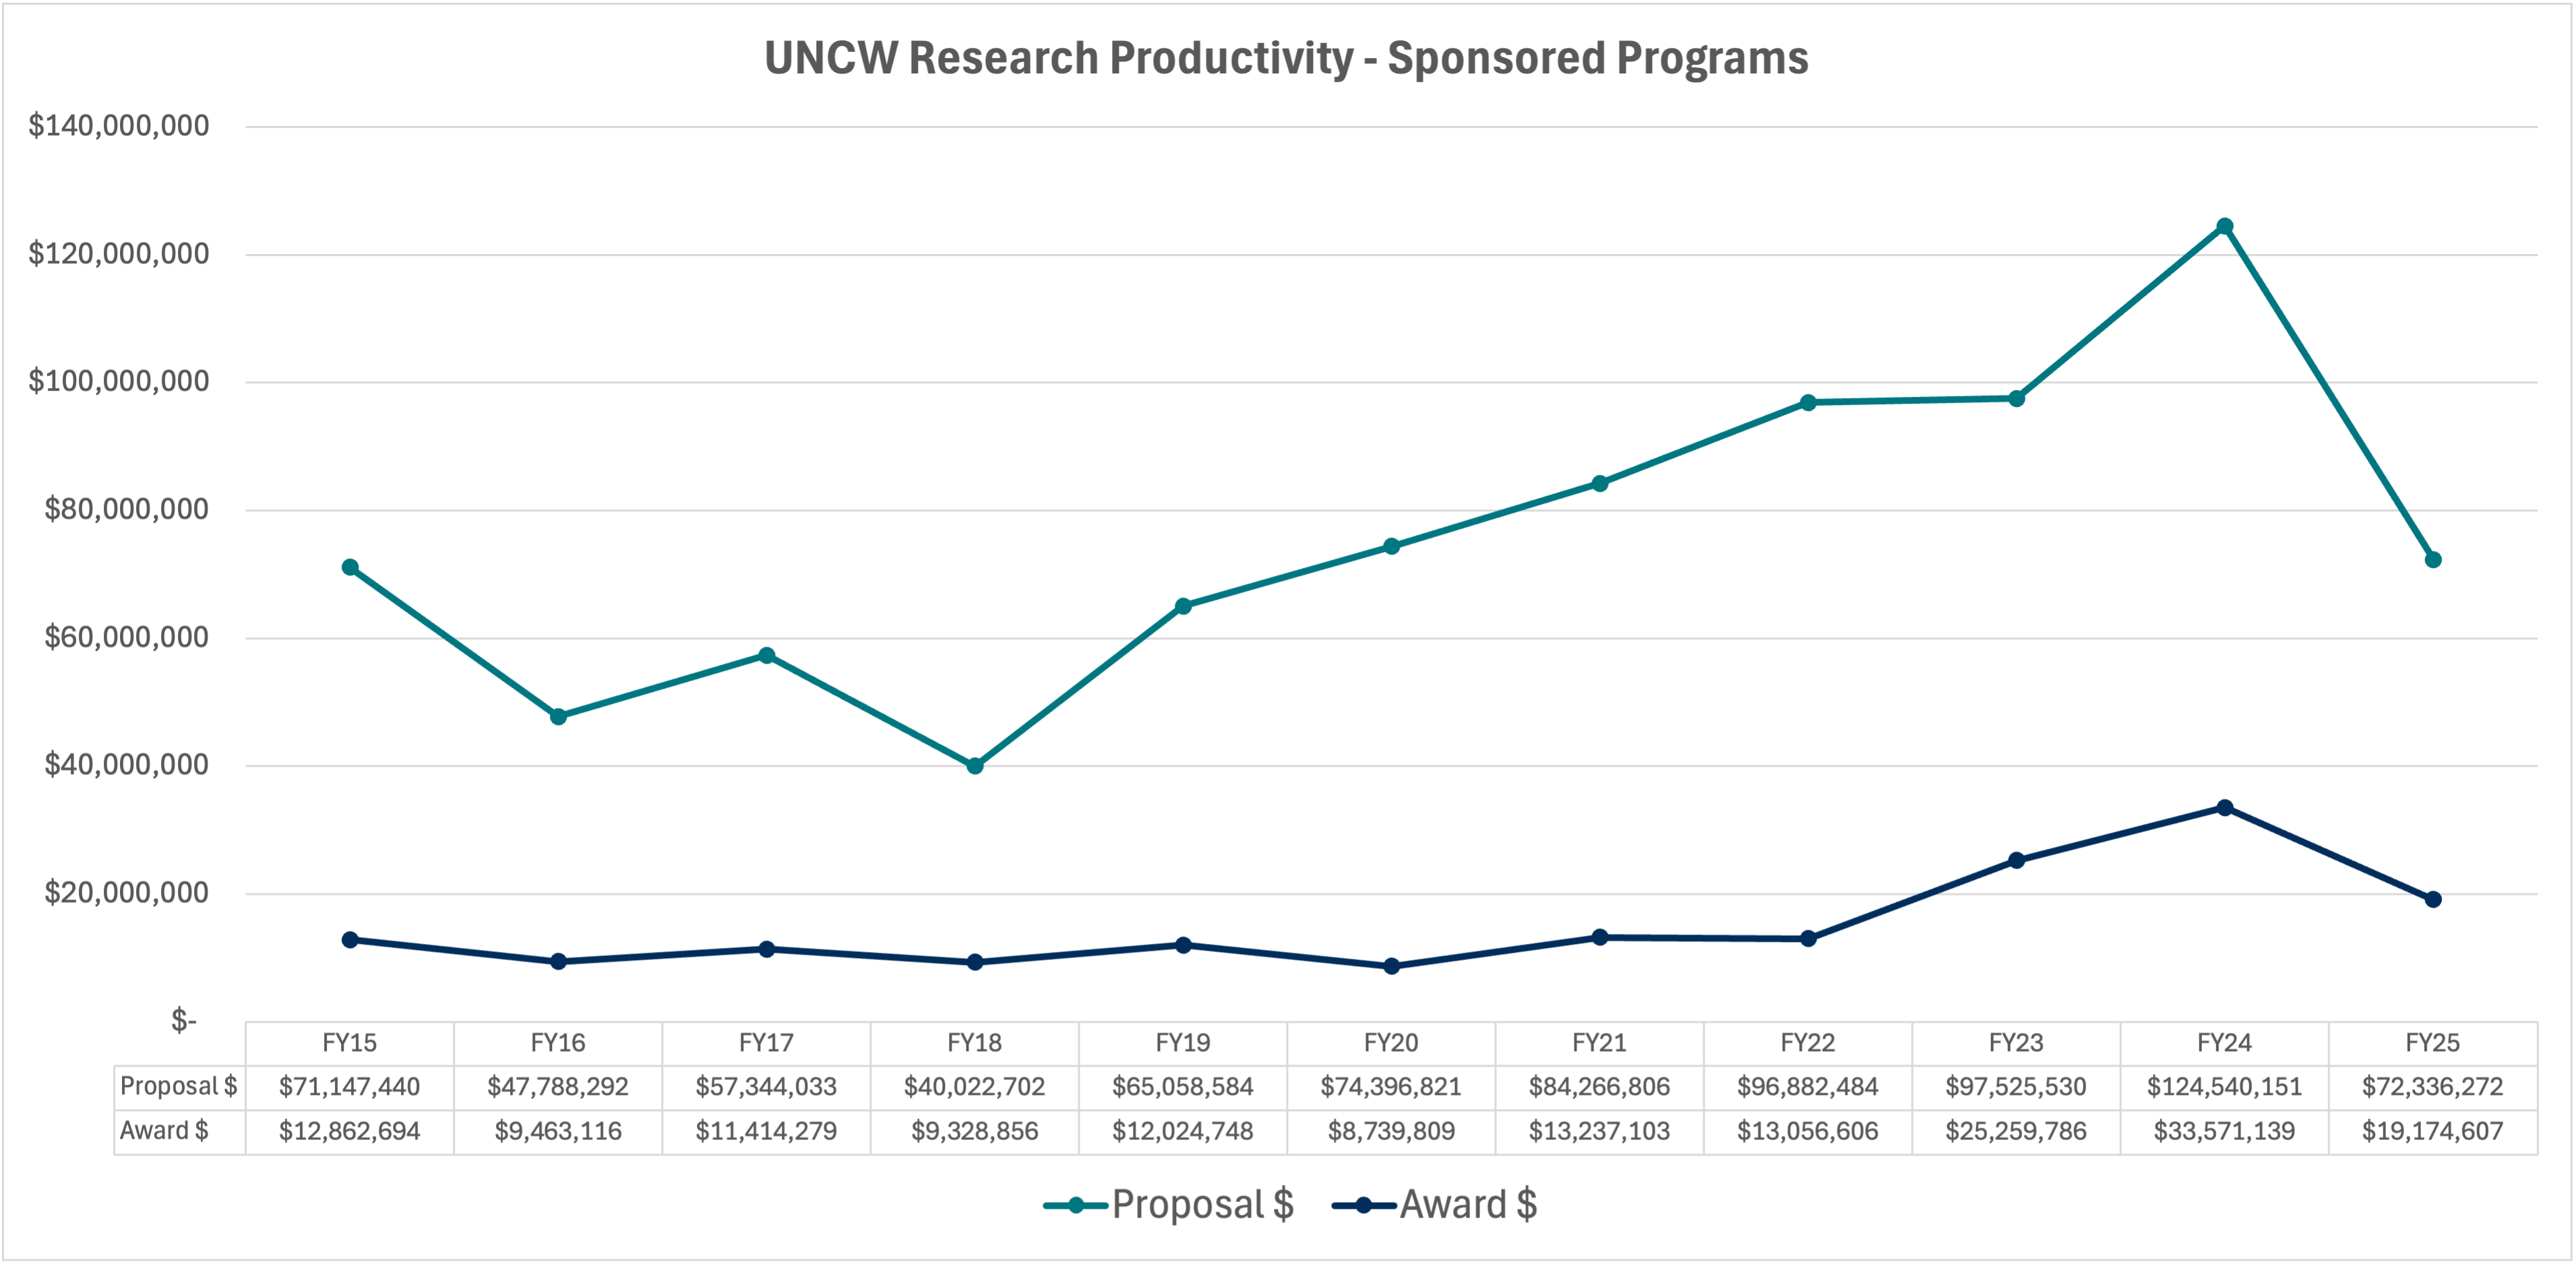
UNCW Research Productivity - Sponsored Programs Data Table
This table provides a detailed view of the UNCW Research Productivity - Sponsored Programs Data shown in the chart above.
| Fiscal Year (FY) | Proposal Amount | Awarded Amount |
|---|---|---|
| FY 15 | $71,147,440 | $12,862,694 |
| FY 16 | $47,788,292 | $9,463,116 |
| FY 17 | $57,344,033 | $11,414,279 |
| FY 18 | $40,022,702 | $9,328,856 |
| FY 19 | $65,058,584 | $12,024,748 |
| FY 20 | $74,396,821 | $8,739,809 |
| FY 21 | $84,266,806 | $13,237,103 |
| FY 22 | $96,882,484 | $13,056,606 |
| FY 23 | $97,525,530 | $25,259,786 |
| FY 24 | $124,540,151 | $33,571,139 |
| FY 25 | $72,336,272 | $19,174,607 |
New Academic Programs
This data shows progress on Priority 7 (academic programs) of the Nationally Prominent Programs pillar.
- B.S. in Public Policy and Administration approved on 05/23/2025
- B.S. in Software Engineering approved on 07/02/2024
- Master of Physician Assistant Studies approved on 07/02/2024
- Doctor of Physical Therapy approved on 02/29/2024
- B.S. in Biochemistry approved on 10/18/2023
- M.S. in Supply Chain Management approved on 11/01/2022
- Ph.D. in Pharmaceutical Chemistry approved on 04/12/2022
- B.S. in Workforce Learning & Talent Development approved on 01/28/2022
Degrees awarded in Critical Workforces
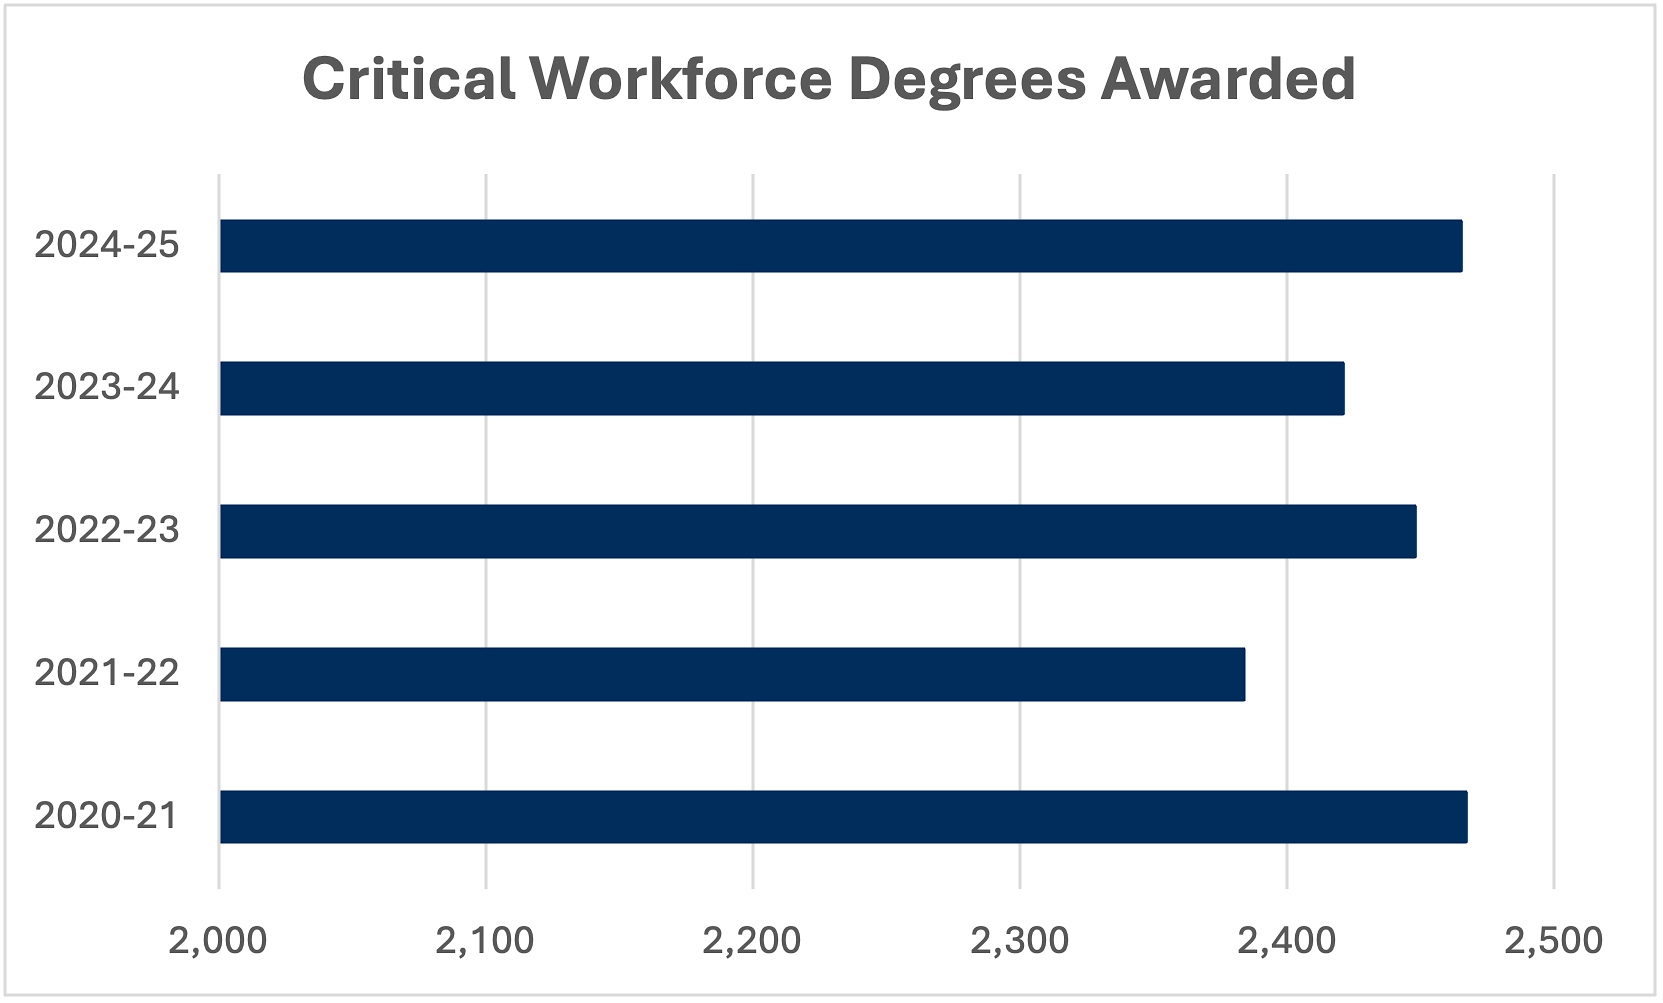
Degrees awarded in Critical Workforces Data Table
This table provides a detailed view of the degrees awarded in Critical Workforces Data shown in the chart above.
| Academic Year | Critical Workforce Degrees Awarded |
|---|---|
| 2020-21 | 2,467 |
| 2021-22 | 2,384 |
| 2022-23 | 2,448 |
| 2023-24 | 2,421 |
| 2024-25 | 2,465 |
Community Commitment Data
Annual UNCW Staff Community Service Hours
This data shows progress on the Community Commitment pillar.
| Year | Total Hours Used | # of Employees |
|---|---|---|
| 2021 | 2,138.75 | 265 |
| 2022 | 2,292.75 | 276 |
| 2023 | 2,770 | 316 |
| 2024 | 3,603.25 | 388 |
Source: UNCW Human Resources Data includes only leave-earning SHRA and EHRA Non-Faculty employees. Faculty members are excluded from this count.
Athletics Attendance & Revenue Data
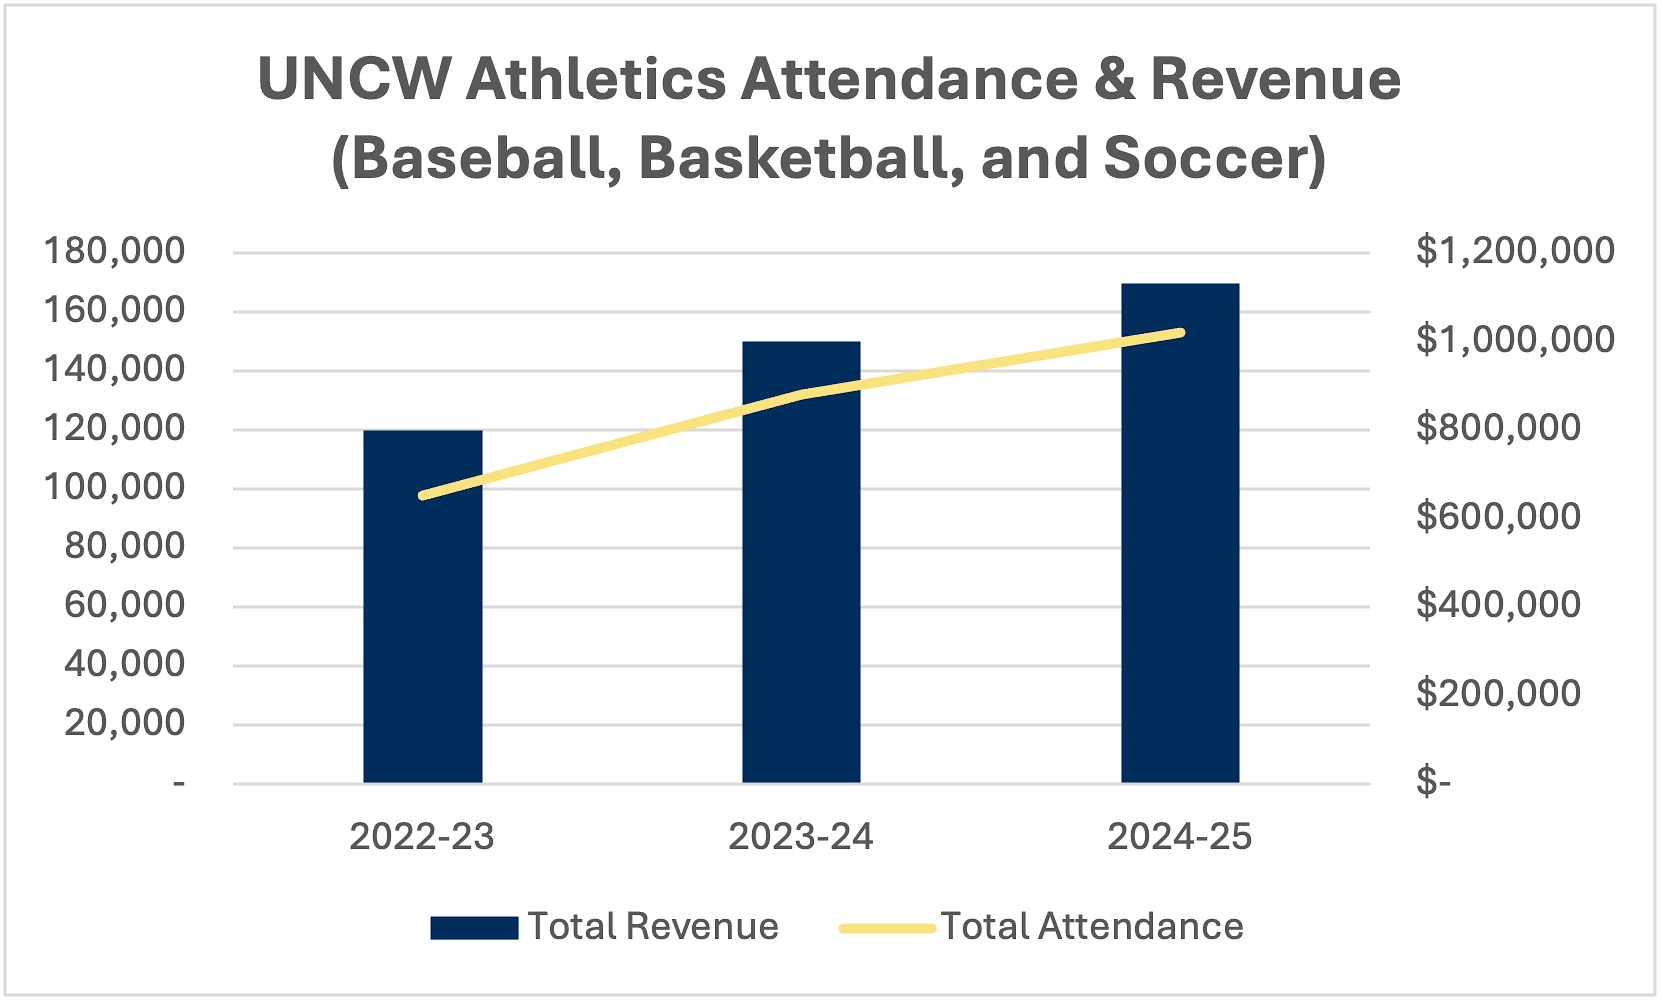
Athletics Attendance & Revenue Data Table
This table provides a detailed view of the Athletics Attendance & Revenue Data shown in the chart above.
| Year | Total Revenue | Total Attendance |
|---|---|---|
| 2022-23 | $797,358 | 97,690 |
| 2023-24 | $999,608 | 132,065 |
| 2024-25 | $1,131,127 | 152,866 |
Lifelong Learners (OLLI) Membership Data
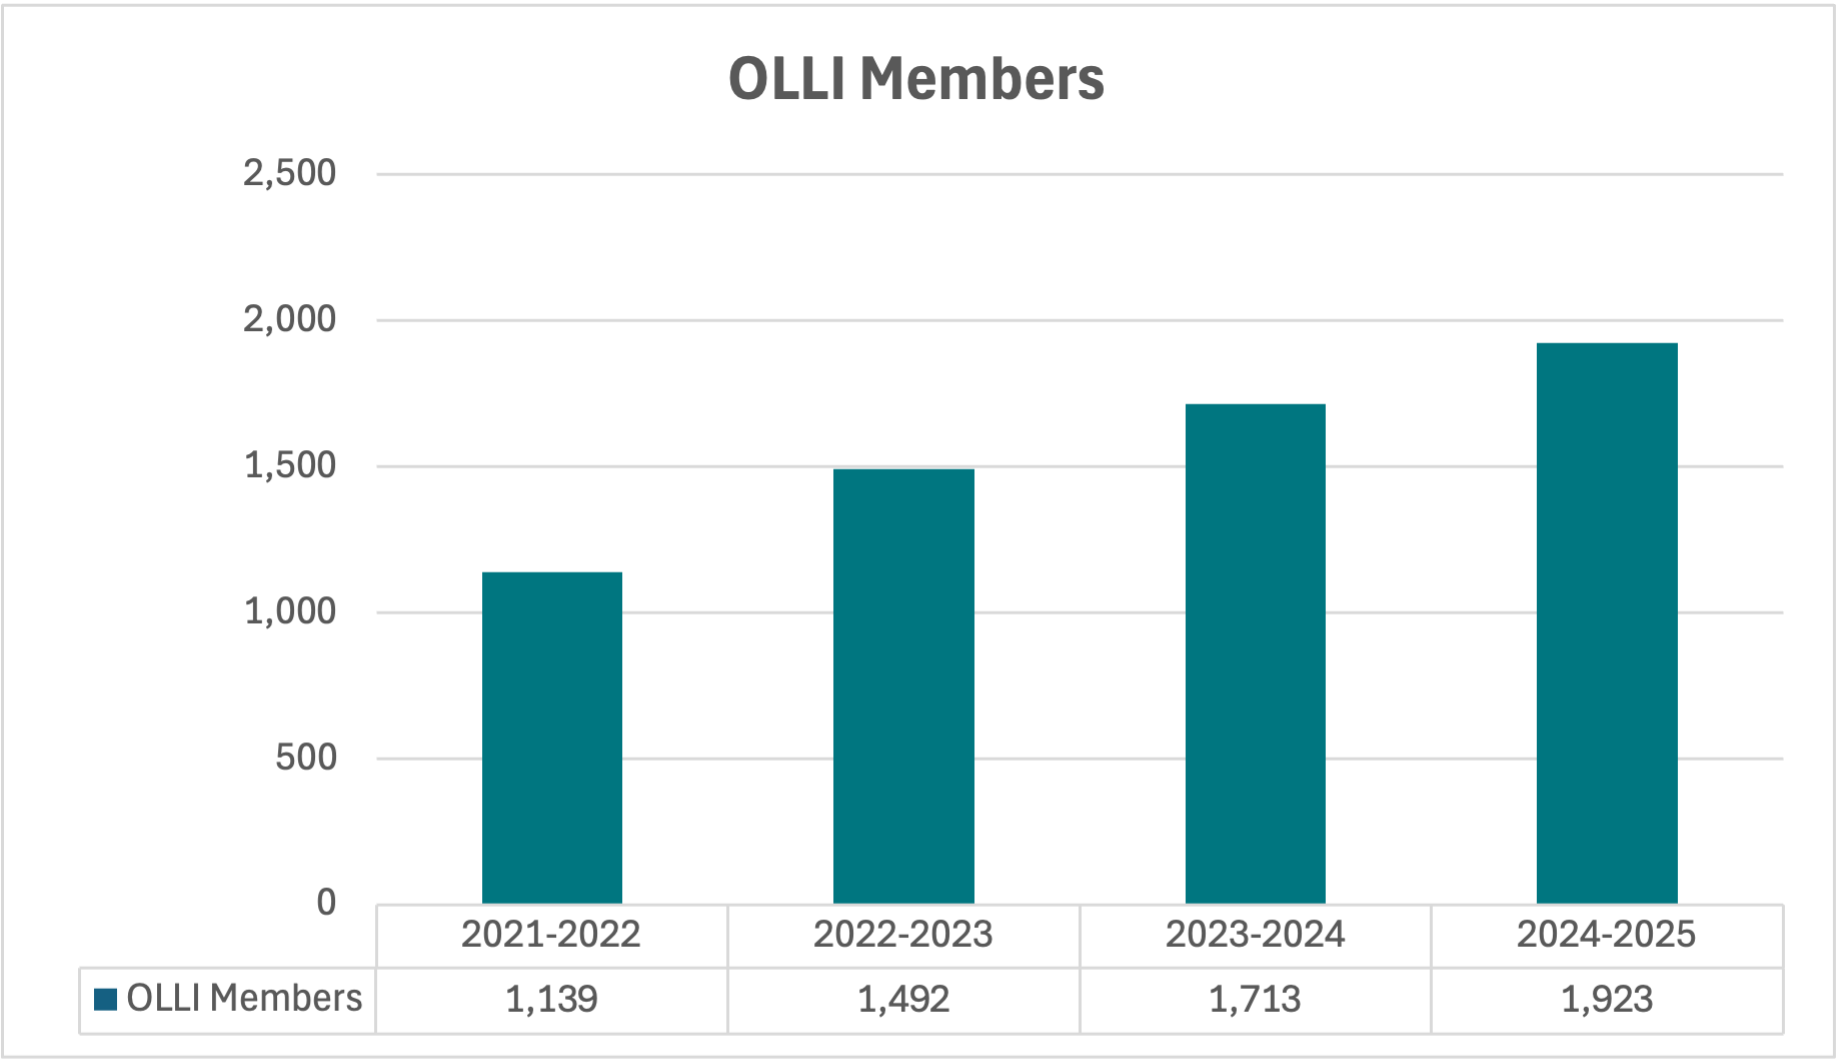
Lifelong Learners (OLLI) Membership Data Table
This table provides a detailed view of the Lifelong Learners (OLLI) Membership Data shown in the chart above.
| Year | OLLI Membership |
|---|---|
| 2021-22 | 1,139 |
| 2022-23 | 1,492 |
| 2023-24 | 1,713 |
| 2024-25 | 1,923 |